How much engagement do your posts on Facebook or Instagram get? Are you happy with your performance?
It’s difficult to assess how good or bad you’re doing without comparative data, and understanding what other brands and creators are seeing. Which is where this new report from Socialinsider comes in.
The team from Socialinsider analyzed 125 million social media posts to get an understanding of the average performance in each app, in regards to engagement rates, likes, comments, and more.
You can check out Socialinsider’s full report here, but in this post, we’ll take a look at the top-line notes.
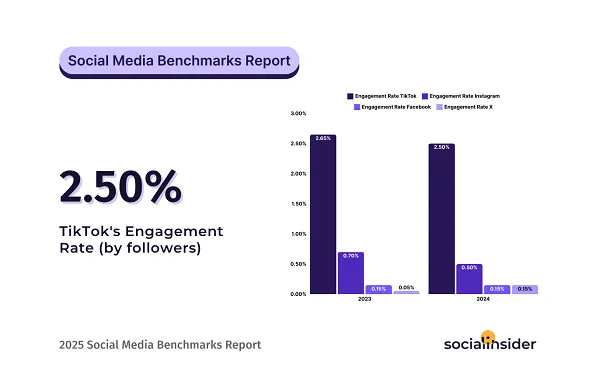
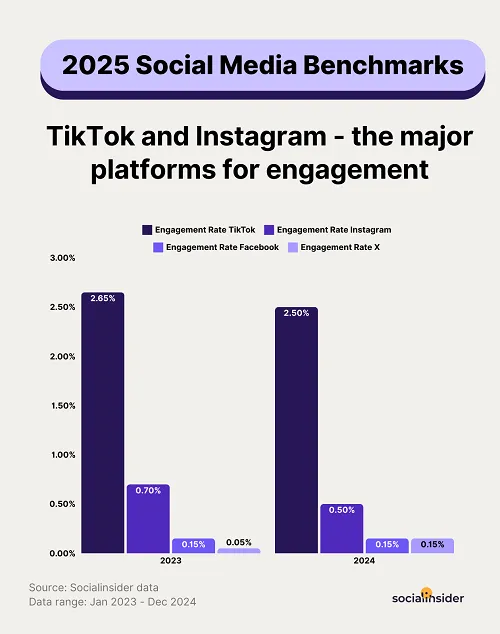
First off, in terms of overall organic engagement, TikTok is driving the best results at present.
As per the report:
“TikTok has solidified itself as the king of organic engagement, with an average engagement rate of 2.50%. The platform’s superior engagement values highlight how TikTok’s algorithm continues to prioritize highly engaging content, rewarding posts that drive conversations and shares.”
Which, if you’re in the U.S., might not be great news, considering that TikTok may well be banned from your region by mid-year.
But right now at least, more posts, on average, are seeing more engagement in the app, with Instagram coming in a distant second.
Facebook average post engagement is even further back, which makes sense, given that Meta’s been looking to put more emphasis on Reels, and reduce the presence of external links. X, meanwhile, saw the worst engagement per post in the period, though it was better last year, on par with Facebook.
It’d be interesting to see the variance here for brands who don’t pay for X Premium, versus those that do, as Premium users get a reach boost. But again, these are average stats, based on the full scope of posts accessed for each app.
Worth noting too that this is based on per profile performance. As explained by Socialinsider:
“Engagement rate per post is calculated as the sum of likes and comments on the post divided by the total number of followers that the profile has. The result is then multiplied by 100.”
So the results are relative to the audience numbers for each profile, not averaged out overall. Which is another relevant point in assessing these data points.
In terms of specific engagement, TikTok videos also see more likes on average than posts in other apps:
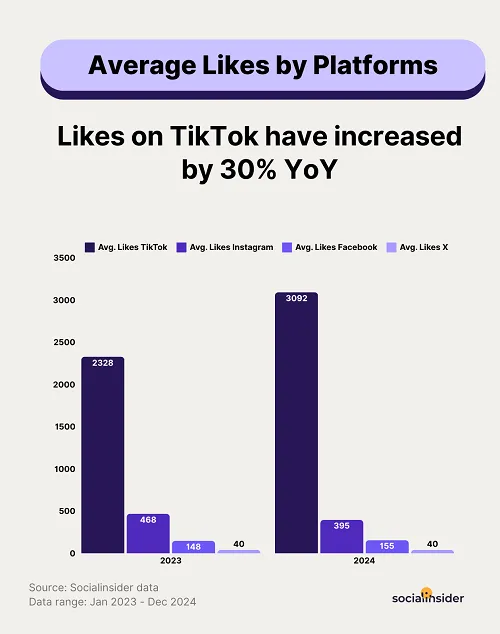
As you can see in this chart, the average amount of likes per TikTok post has also increased, which could reflect a growing familiarity with the app, and what resonates with TikTok audiences.
X likes, meanwhile, are very hard to come by, so don’t be disheartened by your audience’s lack of affection for your updates.
Comments also follow the same overall trend:
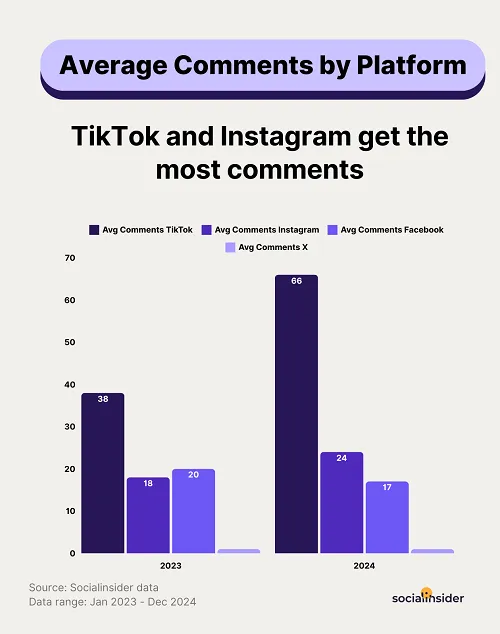
As you can see, Instagram has overtaken Facebook in terms of discussion, though TikTok is again the leader in each element.
The data here could help you contextualize your performance, and get a better understanding of what “good” performance is, and what you can expect. And that understanding might help you maximize your efforts, as opposed to, say, abandoning an app because you’re not getting any traction.
Because as you can see, getting any response on some apps is a good thing.
X, in particular, is looking harder and harder to gain much traction on, as it continues to push users towards its paid subscription and native posting tools.
Does that mean you should dump it? Well, it depends on where your audience is, and maybe, these insights will help you better understand what you should expect from your posts.
You can check out Socialinsider’s full 2025 Social Benchmarks Report here.
Source link